
 Upgrade Storage
Zotero Connector for Safari doesn't respond
I am running Zotero on a MacBook Air M3 running Sequoia 15.7.9 (Safari 26.6). My system Region / Language to United Kingdom / English UK.
Following an update to Zotero 10, the Zotero Connector was missing from the list of Safari Extensions. I went through the recommended procedure of deleting and reinstalling Zotero and the Connector reappeared within the Safari Extensions dialog. It was possible to tick/untick the extension and configure its website permissions. However, the Connector does not function on any webpage - when the Zotero toolbar button in Safari is clicked, nothing happens.
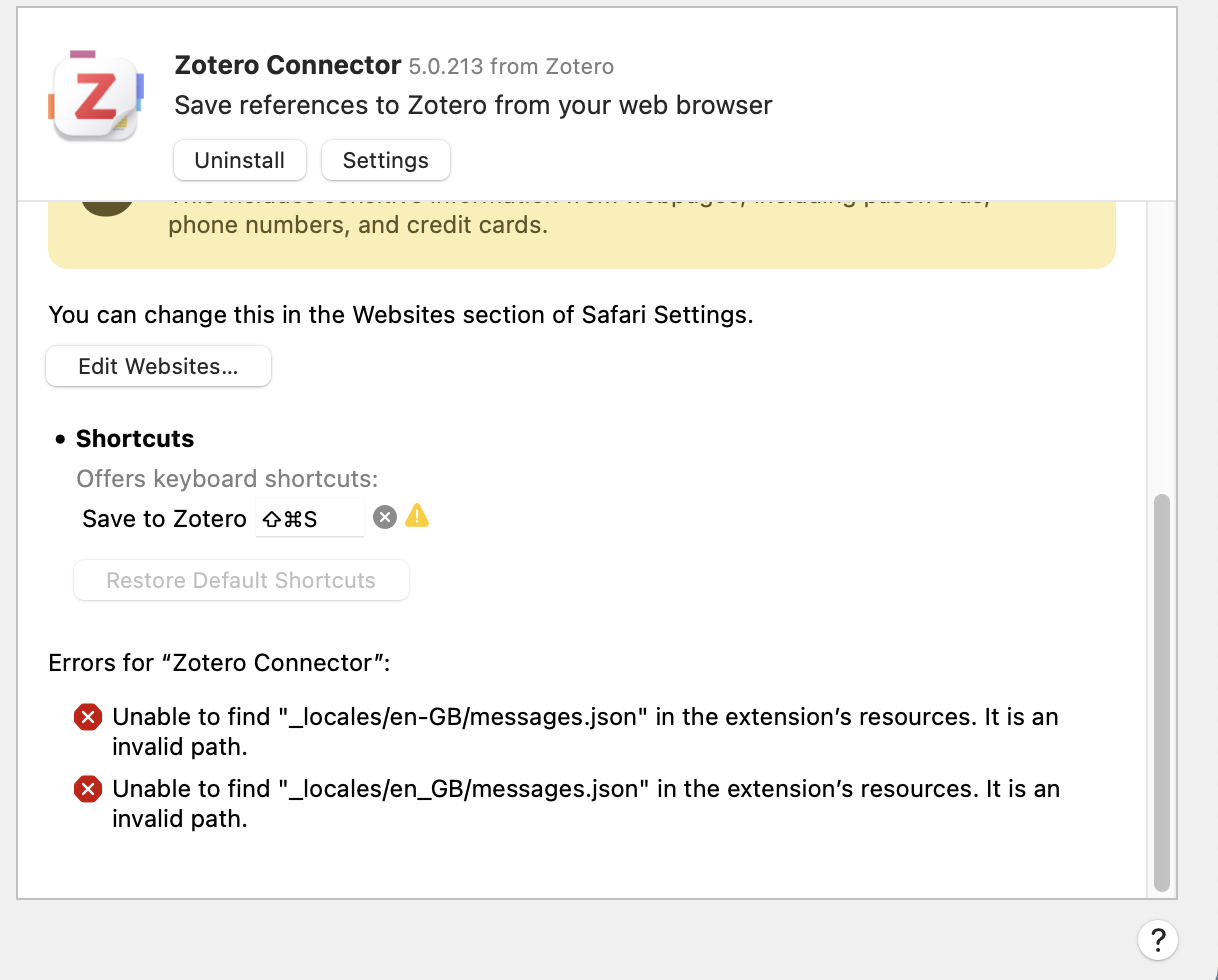
Checking the Zotero Connector panel with the Safari Extensions dialog I see that two errors are reported. They have identical text: 'Unable to find "_locales/en-GB/messages.json" in the extension's resources. It is an invalid path.' [screenshot attached].
The error persists on system restart, reinstallation of Zotero and replacement with Beta 10.0.1. It also appears unaffected by setting Zotero and/or Safari's language to 'English' as opposed to the UK variant.
Hoping someone can help as my workflow's broken and it appears to be difficult / impossible to roll back to v9.
https://s3.amazonaws.com/zotero.org/images/forums/u13200612/22gbuq4ujwm7llcka5qg.png
Following an update to Zotero 10, the Zotero Connector was missing from the list of Safari Extensions. I went through the recommended procedure of deleting and reinstalling Zotero and the Connector reappeared within the Safari Extensions dialog. It was possible to tick/untick the extension and configure its website permissions. However, the Connector does not function on any webpage - when the Zotero toolbar button in Safari is clicked, nothing happens.
Checking the Zotero Connector panel with the Safari Extensions dialog I see that two errors are reported. They have identical text: 'Unable to find "_locales/en-GB/messages.json" in the extension's resources. It is an invalid path.' [screenshot attached].
The error persists on system restart, reinstallation of Zotero and replacement with Beta 10.0.1. It also appears unaffected by setting Zotero and/or Safari's language to 'English' as opposed to the UK variant.
Hoping someone can help as my workflow's broken and it appears to be difficult / impossible to roll back to v9.
https://s3.amazonaws.com/zotero.org/images/forums/u13200612/22gbuq4ujwm7llcka5qg.png
What do you see in the toolbar button?
Are you able to provide a Report ID?
On opening Safari and navigating to a page that usually offers a Zotero saving function, the toolbar shows the Z logo (screenshot below) and is generally unresponsive apart from a right click bringing up the 'Manage extensions' option.
In this mode I am unable to access a Report ID from within Safari as the Zotero Connector option is absent from the webpage's right click menu.
Reloads of the page do not change this situation, whether the reload is normal, 'from origin', or 'without blockers'.
However I have discovered that if I use the 'Manage extensions' menu option in the toolbar and access the Zotero Connector's panel in the dialog, and then open the same webpage in new tab, the Zotero toolbar button changes to the expected graphic (see second screen shot) and functions as normal to save to Zotero locally.
In this mode I am able to access a Report ID: 294309806
Navigating to other pages, the Connector continues to function as expected. However, if I restart Safari, the situation reverts to the one described at the top of this message.
https://s3.amazonaws.com/zotero.org/images/forums/u13200612/6apr84vv01sx0phw4qkd.png
https://s3.amazonaws.com/zotero.org/images/forums/u13200612/pbswkhqkzrblzay3o90y.png
However if I relaunch Safari with the default 'Base' profile, the Connector is immediately in its working state within that window - here is a Report ID from that context: 2096271279
If subsequently open an additional window using my normal profile, then I am back to a non-functioning Connector in the new window, until I access the Manage Extension dialog along the lines I described previously.
I reloaded the page using the control in the Web Inspector and this step leaves the Connector button in the toolbar unaltered and showing Z. The Console reads:
[Log] (3)(+0000000): Setting debug.store to false (debug.js, line 92)
[Error] Failed to load resource: The requested URL was not found on this server.
[Error] Failed to load resource: The requested URL was not found on this server.
[Log] (3)(+0000004): Translators: Saved 749 translators. (debug.js, line 92)
[Log] (3)(+0000000): Repo: Next check in 16456.261s (debug.js, line 92)
[Log] (3)(+0000001): HTTP GET safari-web-extension://629F14C5-2F52-434E-AA02-F3FF0D963D8A/utilities/resource/dateFormats.json (debug.js, line 92)
[Log] (3)(+0000001): HTTP 200 safari-web-extension://629F14C5-2F52-434E-AA02-F3FF0D963D8A/utilities/resource/dateFormats.json response (debug.js, line 92)
[Log] (3)(+0000000): Setting lastVersion to "5.0.213" (debug.js, line 92)
***Having done this I noticed that if I open a new tab in the browser window after accessing the Web Extension Background Context, the Zotero Connector functions properly in this new tab, but continues to be an unresponsive Z in the old one. Below I have pasted the additional console entries that are generated once I have navigated to a webpage in the new tab.****
[Log] (3)(+0084600): Connector_Browser: onFrameLoaded for https://www.theguardian.com/uk; https://www.theguardian.com/uk (debug.js, line 89)
[Log] (3)(+0000351): HTTP GET safari-web-extension://629F14C5-2F52-434E-AA02-F3FF0D963D8A/utilities/resource/dateFormats.json (debug.js, line 92)
[Log] (3)(+0000000): HTTP 200 safari-web-extension://629F14C5-2F52-434E-AA02-F3FF0D963D8A/utilities/resource/dateFormats.json response (debug.js, line 92)
[Log] (3)(+0000280): HTTP POST http://127.0.0.1:23119/connector/ping (debug.js, line 92)
[Log] (3)(+0000009): HTTP 200 http://127.0.0.1:23119/connector/ping response (debug.js, line 92)
[Log] (3)(+0000000): Setting firstSaveToServer to true (debug.js, line 92)
[Log] (3)(+0000000): Connector: Method ping succeeded (debug.js, line 92)
[Log] (3)(+0000204): Translators: Looking for translators for https://www.theguardian.com/uk (debug.js, line 92)
[Log] (4)(+0000024): Translate: Binding sandbox to https://www.theguardian.com/uk (debug.js, line 92)
[Log] (4)(+0000022): Translate: Parsing code for The Guardian (8e11559d-60f0-4a7f-bb91-99ac0c5a2d63, 2021-09-13 21:32:27) (debug.js, line 92)
[Log] (4)(+0000058): Translate: Parsing code for unAPI (e7e01cac-1e37-4da6-b078-a0e8343b0e98, 2019-06-10 23:11:21) (debug.js, line 92)
[Log] (4)(+0000011): Translate: Parsing code for COinS (05d07af9-105a-4572-99f6-a8e231c0daef, 2021-06-01 17:38:46) (debug.js, line 92)
[Log] (4)(+0000088): Translate: Parsing code for Embedded Metadata (951c027d-74ac-47d4-a107-9c3069ab7b48, 2026-04-27 15:35:00) (debug.js, line 92)
[Log] (3)(+0000000): Translate: Embedded Metadata: found 6 meta tags (debug.js, line 92)
[Log] (4)(+0000033): Translate: Parsing code for DOI (c159dcfe-8a53-4301-a499-30f6549c340d, 2026-08-05 20:30:00) (debug.js, line 92)
[Log] (3)(+0000001): Translate: All translator detect calls and RPC calls complete: (debug.js, line 92)
[Log] (3)(+0000000): No suitable translators found (debug.js, line 92)
[Log] (5)(+0000000): Translate: Running handler 0 for translators (debug.js, line 92)
[Log] (3)(+0002822): Connector_Browser: onFrameLoaded for https://www.theguardian.com/uk-news/2026/aug/23/tributes-paid-cleveland-police-killed-a66-crash-south-bank; https://www.theguardian.com/uk-news/2026/aug/23/tributes-paid-cleveland-police-killed-a66-crash-south-bank (debug.js, line 89)
[Log] (3)(+0000000): Connector_Browser: URL changed from https://www.theguardian.com/uk to https://www.theguardian.com/uk-news/2026/aug/23/tributes-paid-cleveland-police-killed-a66-crash-south-bank (debug.js, line 92)
[Log] (3)(+0000050): HTTP GET safari-web-extension://629F14C5-2F52-434E-AA02-F3FF0D963D8A/utilities/resource/dateFormats.json (debug.js, line 92)
[Log] (3)(+0000001): HTTP 200 safari-web-extension://629F14C5-2F52-434E-AA02-F3FF0D963D8A/utilities/resource/dateFormats.json response (debug.js, line 92)
[Log] (3)(+0000318): Translators: Looking for translators for https://www.theguardian.com/uk-news/2026/aug/23/tributes-paid-cleveland-police-killed-a66-crash-south-bank (debug.js, line 92)
[Log] (4)(+0000027): Translate: Binding sandbox to https://www.theguardian.com/uk-news/2026/aug/23/tributes-paid-cleveland-police-killed-a66-crash-south-bank (debug.js, line 92)
[Log] (4)(+0000018): Translate: Parsing code for The Guardian (8e11559d-60f0-4a7f-bb91-99ac0c5a2d63, 2021-09-13 21:32:27) (debug.js, line 92)
[Log] (4)(+0000013): Translate: Parsing code for unAPI (e7e01cac-1e37-4da6-b078-a0e8343b0e98, 2019-06-10 23:11:21) (debug.js, line 92)
[Log] (4)(+0000019): Translate: Parsing code for COinS (05d07af9-105a-4572-99f6-a8e231c0daef, 2021-06-01 17:38:46) (debug.js, line 92)
[Log] (4)(+0000005): Translate: Parsing code for Embedded Metadata (951c027d-74ac-47d4-a107-9c3069ab7b48, 2026-04-27 15:35:00) (debug.js, line 92)
[Log] (3)(+0000001): Translate: Embedded Metadata: found 37 meta tags (debug.js, line 92)
[Log] (3)(+0000000): Translate: Creating translate instance of type import in sandbox (debug.js, line 92)
[Log] (4)(+0000028): Translate: Binding sandbox to https://www.theguardian.com/uk-news/2026/aug/23/tributes-paid-cleveland-police-killed-a66-crash-south-bank (debug.js, line 92)
[Log] (4)(+0000026): Translate: Parsing code for RDF (5e3ad958-ac79-463d-812b-a86a9235c28f, 2026-08-12 16:55:00) (debug.js, line 92)
[Log] (3)(+0000001): Translate: Initializing RDF data store (debug.js, line 92)
[Log] (4)(+0000003): Translate: Parsing code for DOI (c159dcfe-8a53-4301-a499-30f6549c340d, 2026-08-05 20:30:00) (debug.js, line 92)
[Log] (3)(+0000001): Translate: All translator detect calls and RPC calls complete: (debug.js, line 92)
[Log] (3)(+0000000): The Guardian: 100 (debug.js, line 92)
[Log] (3)(+0000000): Embedded Metadata: 320 (debug.js, line 92)
[Log] (5)(+0000000): Translate: Running handler 0 for translators (debug.js, line 92)
[Log] (5)(+0000000): Translate: Running handler 1 for translators (debug.js, line 92)
Picking up your suggestion of a browser bug, I have looked for similar problems with the other extensions I use. Four are unaffected: '1Password', 'AdGuard', 'xSearch' and 'StopTheMadness Pro'. The fifth (with functionality most like that of Zotero Connector?), 'Goodlinks' is subject to the same problem and work around.
Good luck with any v10 bugs that are more clearly in Zotero's court.